galectin 3 Search Results


94
R&D Systems anti goat gal3 antibody
Anti Goat Gal3 Antibody, supplied by R&D Systems, used in various techniques. Bioz Stars score: 94/100, based on 1 PubMed citations. ZERO BIAS - scores, article reviews, protocol conditions and more
https://www.bioz.com/result/anti goat gal3 antibody/product/R&D Systems
Average 94 stars, based on 1 article reviews
anti goat gal3 antibody - by Bioz Stars, 2026-04
94/100 stars
  Buy from Supplier

90
R&D Systems mouse galectin 3 elisa kit
Mouse Galectin 3 Elisa Kit, supplied by R&D Systems, used in various techniques. Bioz Stars score: 90/100, based on 1 PubMed citations. ZERO BIAS - scores, article reviews, protocol conditions and more
https://www.bioz.com/result/mouse galectin 3 elisa kit/product/R&D Systems
Average 90 stars, based on 1 article reviews
mouse galectin 3 elisa kit - by Bioz Stars, 2026-04
90/100 stars
  Buy from Supplier

96
R&D Systems mouse gal 3 duoset elisa kit
Mouse Gal 3 Duoset Elisa Kit, supplied by R&D Systems, used in various techniques. Bioz Stars score: 96/100, based on 1 PubMed citations. ZERO BIAS - scores, article reviews, protocol conditions and more
https://www.bioz.com/result/mouse gal 3 duoset elisa kit/product/R&D Systems
Average 96 stars, based on 1 article reviews
mouse gal 3 duoset elisa kit - by Bioz Stars, 2026-04
96/100 stars
  Buy from Supplier

94
R&D Systems biotinylated antibody baf1154
Biotinylated Antibody Baf1154, supplied by R&D Systems, used in various techniques. Bioz Stars score: 94/100, based on 1 PubMed citations. ZERO BIAS - scores, article reviews, protocol conditions and more
https://www.bioz.com/result/biotinylated antibody baf1154/product/R&D Systems
Average 94 stars, based on 1 article reviews
biotinylated antibody baf1154 - by Bioz Stars, 2026-04
94/100 stars
  Buy from Supplier

94
R&D Systems recombinant human galectin 3 protein
Representative western blot of pSmad2 levels in (A) non-IPF HLFs (N=3) and (B) iHBECs (N=2) pre-treated with S0 μM SB-431S42 (ALKS inhibitor) or 1 μM GB0139 <t>(galectin-3</t> inhibitor) for 20 minutes prior to 2-hour treatment with 10 μg/mL galectin-3 or 2 ng/mL TGF-β1. Western blot bands were quantified using densitometry analysis and presented as a ratio of pSmad2/tSmad2.
Recombinant Human Galectin 3 Protein, supplied by R&D Systems, used in various techniques. Bioz Stars score: 94/100, based on 1 PubMed citations. ZERO BIAS - scores, article reviews, protocol conditions and more
https://www.bioz.com/result/recombinant human galectin 3 protein/product/R&D Systems
Average 94 stars, based on 1 article reviews
recombinant human galectin 3 protein - by Bioz Stars, 2026-04
94/100 stars
  Buy from Supplier

93
R&D Systems recombinant galectin
Representative western blot of pSmad2 levels in (A) non-IPF HLFs (N=3) and (B) iHBECs (N=2) pre-treated with S0 μM SB-431S42 (ALKS inhibitor) or 1 μM GB0139 <t>(galectin-3</t> inhibitor) for 20 minutes prior to 2-hour treatment with 10 μg/mL galectin-3 or 2 ng/mL TGF-β1. Western blot bands were quantified using densitometry analysis and presented as a ratio of pSmad2/tSmad2.
Recombinant Galectin, supplied by R&D Systems, used in various techniques. Bioz Stars score: 93/100, based on 1 PubMed citations. ZERO BIAS - scores, article reviews, protocol conditions and more
https://www.bioz.com/result/recombinant galectin/product/R&D Systems
Average 93 stars, based on 1 article reviews
recombinant galectin - by Bioz Stars, 2026-04
93/100 stars
  Buy from Supplier

99
R&D Systems human gal 3 quantikine kit
Representative western blot of pSmad2 levels in (A) non-IPF HLFs (N=3) and (B) iHBECs (N=2) pre-treated with S0 μM SB-431S42 (ALKS inhibitor) or 1 μM GB0139 <t>(galectin-3</t> inhibitor) for 20 minutes prior to 2-hour treatment with 10 μg/mL galectin-3 or 2 ng/mL TGF-β1. Western blot bands were quantified using densitometry analysis and presented as a ratio of pSmad2/tSmad2.
Human Gal 3 Quantikine Kit, supplied by R&D Systems, used in various techniques. Bioz Stars score: 99/100, based on 1 PubMed citations. ZERO BIAS - scores, article reviews, protocol conditions and more
https://www.bioz.com/result/human gal 3 quantikine kit/product/R&D Systems
Average 99 stars, based on 1 article reviews
human gal 3 quantikine kit - by Bioz Stars, 2026-04
99/100 stars
  Buy from Supplier

94
Proteintech rabbit antibodies against galectin 3
Identification of DEPs and DEGs by proteomic and transcriptome analysis of the aortas of ApoE −/− mice versus HFD‐fed ApoE −/− mice. (A) Volcano plot analysis represents the up‐ or downregulated DEPs abundance changes in the aortas from ApoE −/− mice versus HFD‐fed ApoE −/− mice. Blue indicates upregulated genes, green indicates downregulated genes, and grey indicates genes with unchanged genes. (B) The top six upregulated DEPs consisting of <t>lgals3/galectin‐3,</t> nucb2, ighm, vcam1, serpina1e and serpina3n between ApoE −/− mice and HFD‐fed ApoE −/− mice. (C) Numbers of DEGs are enriched in the identified pathway. Apoptosis is identified as the critical cell death forms. The x ‐axis represents the number of enriched genes, and the y ‐axis represents the name of the enriched KEGG pathway. (D) Compared to ApoE −/− mice, the gene set upregulated in HFD‐fed ApoE −/− mice is enriched in the signal pathways including foal adhesion, leukocyte transendothelial migration, Toll‐like receptor signalling pathway, natural killer cell mediated cytotoxicity, and apoptosis. (E) The Volcano plot illustrates that gene transcripts with a log2 fold change greater than 1 and a significant p ‐value less than.05 are differently expressed between normal and atherosclerosis. Red represents upregulation, blue represents downregulation, and grey represents no change. (F) KEGG enrichment of DEGs indicates that apoptosis emerged as the fifth pathway of significant alteration. KEGG pathway analysis is performed with bar plot. Colours correspond to the p ‐value, with red indicates more significant enrichment. (G) Venn diagram is performed to screen out the overlapping DEPs and DEGs. (H) The coordinated DEPs and DEGs, consisting of Galectin/Lgals3, Vcam1 and Ctss, are differentially expressed between ApoE −/− control mice and HFD‐fed ApoE −/− mice.
Rabbit Antibodies Against Galectin 3, supplied by Proteintech, used in various techniques. Bioz Stars score: 94/100, based on 1 PubMed citations. ZERO BIAS - scores, article reviews, protocol conditions and more
https://www.bioz.com/result/rabbit antibodies against galectin 3/product/Proteintech
Average 94 stars, based on 1 article reviews
rabbit antibodies against galectin 3 - by Bioz Stars, 2026-04
94/100 stars
  Buy from Supplier

95
Santa Cruz Biotechnology anti galectin3
Ub-positive endosomes containing Salmonella or beads are targeted by autophagy. (A) HeLa cells were infected with S. Typhimurium ( Salmonella ) for 1 h or transfected with Effectene-coated latex beads for 3 h and then subjected to immunocytochemistry for LC3 and transferrin receptor (TfR). Bar, 10 µm. (B) HeLa cells were infected with Salmonella for 1 h or transfected with Effectene-coated latex beads for 3 h and then subjected to immunocytochemistry for LC3 and <t>galectin3.</t> Bar, 5 µm. (C) HeLa cells were transfected with Effectene-coated latex beads for 3 h and subjected to immunocytochemistry for LC3 and Ub (top) or LC3 and p62 (bottom). Bar, 5 µm. The percentages of LC3- or p62-positive beads per Ub-positive (Ub+) or Ub-negative (Ub−) beads were enumerated. Statistical analysis was performed by Student’s unpaired t test. *, P < 0.01. (D and E) HeLa cells stably expressing GFP-LC3 were transfected with Effectene-coated latex beads for 3 h. Bead–autophagosomes were fractionated as described in Materials and methods. The bead–autophagosome fraction was observed by confocal microscopy (D; bar, 10 µm) or lysed with RIPA buffer and subjected to Western blot analysis using the indicated antibodies (E). In a control sample, scraped cells were mixed with Effectene-coated beads and immediately homogenized. (F) The bead–autophagosome fraction was lysed and subjected to immunoprecipitation with an anti-Ub IgG antibody (FK2) or control IgG. Co-immunoprecipitated molecules were examined by Western blotting using the indicated antibodies. (G and H) NIH3T3 cells stably expressing mStrawberry (mStr)-Gal3 and GFP-LC3, mStr-Gal3, and GFP-p62, or mStr-Gal3 and GFP-Ub were transfected with Effectene-coated latex beads for 30 min and then washed. Live cells were observed at 1-min intervals by fluorescence microscopy. Bar, 3 µm. The time after galectin3 localization was measured for at least 30 cases for each combination (H). Statistical analysis was performed by Student’s unpaired t test. *, P < 0.05; NS, not significant.
Anti Galectin3, supplied by Santa Cruz Biotechnology, used in various techniques. Bioz Stars score: 95/100, based on 1 PubMed citations. ZERO BIAS - scores, article reviews, protocol conditions and more
https://www.bioz.com/result/anti galectin3/product/Santa Cruz Biotechnology
Average 95 stars, based on 1 article reviews
anti galectin3 - by Bioz Stars, 2026-04
95/100 stars
  Buy from Supplier

93
Novus Biologicals nb300
Ub-positive endosomes containing Salmonella or beads are targeted by autophagy. (A) HeLa cells were infected with S. Typhimurium ( Salmonella ) for 1 h or transfected with Effectene-coated latex beads for 3 h and then subjected to immunocytochemistry for LC3 and transferrin receptor (TfR). Bar, 10 µm. (B) HeLa cells were infected with Salmonella for 1 h or transfected with Effectene-coated latex beads for 3 h and then subjected to immunocytochemistry for LC3 and <t>galectin3.</t> Bar, 5 µm. (C) HeLa cells were transfected with Effectene-coated latex beads for 3 h and subjected to immunocytochemistry for LC3 and Ub (top) or LC3 and p62 (bottom). Bar, 5 µm. The percentages of LC3- or p62-positive beads per Ub-positive (Ub+) or Ub-negative (Ub−) beads were enumerated. Statistical analysis was performed by Student’s unpaired t test. *, P < 0.01. (D and E) HeLa cells stably expressing GFP-LC3 were transfected with Effectene-coated latex beads for 3 h. Bead–autophagosomes were fractionated as described in Materials and methods. The bead–autophagosome fraction was observed by confocal microscopy (D; bar, 10 µm) or lysed with RIPA buffer and subjected to Western blot analysis using the indicated antibodies (E). In a control sample, scraped cells were mixed with Effectene-coated beads and immediately homogenized. (F) The bead–autophagosome fraction was lysed and subjected to immunoprecipitation with an anti-Ub IgG antibody (FK2) or control IgG. Co-immunoprecipitated molecules were examined by Western blotting using the indicated antibodies. (G and H) NIH3T3 cells stably expressing mStrawberry (mStr)-Gal3 and GFP-LC3, mStr-Gal3, and GFP-p62, or mStr-Gal3 and GFP-Ub were transfected with Effectene-coated latex beads for 30 min and then washed. Live cells were observed at 1-min intervals by fluorescence microscopy. Bar, 3 µm. The time after galectin3 localization was measured for at least 30 cases for each combination (H). Statistical analysis was performed by Student’s unpaired t test. *, P < 0.05; NS, not significant.
Nb300, supplied by Novus Biologicals, used in various techniques. Bioz Stars score: 93/100, based on 1 PubMed citations. ZERO BIAS - scores, article reviews, protocol conditions and more
https://www.bioz.com/result/nb300/product/Novus Biologicals
Average 93 stars, based on 1 article reviews
nb300 - by Bioz Stars, 2026-04
93/100 stars
  Buy from Supplier

94
Cedarlane rat anti human mac2
Ub-positive endosomes containing Salmonella or beads are targeted by autophagy. (A) HeLa cells were infected with S. Typhimurium ( Salmonella ) for 1 h or transfected with Effectene-coated latex beads for 3 h and then subjected to immunocytochemistry for LC3 and transferrin receptor (TfR). Bar, 10 µm. (B) HeLa cells were infected with Salmonella for 1 h or transfected with Effectene-coated latex beads for 3 h and then subjected to immunocytochemistry for LC3 and <t>galectin3.</t> Bar, 5 µm. (C) HeLa cells were transfected with Effectene-coated latex beads for 3 h and subjected to immunocytochemistry for LC3 and Ub (top) or LC3 and p62 (bottom). Bar, 5 µm. The percentages of LC3- or p62-positive beads per Ub-positive (Ub+) or Ub-negative (Ub−) beads were enumerated. Statistical analysis was performed by Student’s unpaired t test. *, P < 0.01. (D and E) HeLa cells stably expressing GFP-LC3 were transfected with Effectene-coated latex beads for 3 h. Bead–autophagosomes were fractionated as described in Materials and methods. The bead–autophagosome fraction was observed by confocal microscopy (D; bar, 10 µm) or lysed with RIPA buffer and subjected to Western blot analysis using the indicated antibodies (E). In a control sample, scraped cells were mixed with Effectene-coated beads and immediately homogenized. (F) The bead–autophagosome fraction was lysed and subjected to immunoprecipitation with an anti-Ub IgG antibody (FK2) or control IgG. Co-immunoprecipitated molecules were examined by Western blotting using the indicated antibodies. (G and H) NIH3T3 cells stably expressing mStrawberry (mStr)-Gal3 and GFP-LC3, mStr-Gal3, and GFP-p62, or mStr-Gal3 and GFP-Ub were transfected with Effectene-coated latex beads for 30 min and then washed. Live cells were observed at 1-min intervals by fluorescence microscopy. Bar, 3 µm. The time after galectin3 localization was measured for at least 30 cases for each combination (H). Statistical analysis was performed by Student’s unpaired t test. *, P < 0.05; NS, not significant.
Rat Anti Human Mac2, supplied by Cedarlane, used in various techniques. Bioz Stars score: 94/100, based on 1 PubMed citations. ZERO BIAS - scores, article reviews, protocol conditions and more
https://www.bioz.com/result/rat anti human mac2/product/Cedarlane
Average 94 stars, based on 1 article reviews
rat anti human mac2 - by Bioz Stars, 2026-04
94/100 stars
  Buy from Supplier

93
Cedarlane anti mac2
Ub-positive endosomes containing Salmonella or beads are targeted by autophagy. (A) HeLa cells were infected with S. Typhimurium ( Salmonella ) for 1 h or transfected with Effectene-coated latex beads for 3 h and then subjected to immunocytochemistry for LC3 and transferrin receptor (TfR). Bar, 10 µm. (B) HeLa cells were infected with Salmonella for 1 h or transfected with Effectene-coated latex beads for 3 h and then subjected to immunocytochemistry for LC3 and <t>galectin3.</t> Bar, 5 µm. (C) HeLa cells were transfected with Effectene-coated latex beads for 3 h and subjected to immunocytochemistry for LC3 and Ub (top) or LC3 and p62 (bottom). Bar, 5 µm. The percentages of LC3- or p62-positive beads per Ub-positive (Ub+) or Ub-negative (Ub−) beads were enumerated. Statistical analysis was performed by Student’s unpaired t test. *, P < 0.01. (D and E) HeLa cells stably expressing GFP-LC3 were transfected with Effectene-coated latex beads for 3 h. Bead–autophagosomes were fractionated as described in Materials and methods. The bead–autophagosome fraction was observed by confocal microscopy (D; bar, 10 µm) or lysed with RIPA buffer and subjected to Western blot analysis using the indicated antibodies (E). In a control sample, scraped cells were mixed with Effectene-coated beads and immediately homogenized. (F) The bead–autophagosome fraction was lysed and subjected to immunoprecipitation with an anti-Ub IgG antibody (FK2) or control IgG. Co-immunoprecipitated molecules were examined by Western blotting using the indicated antibodies. (G and H) NIH3T3 cells stably expressing mStrawberry (mStr)-Gal3 and GFP-LC3, mStr-Gal3, and GFP-p62, or mStr-Gal3 and GFP-Ub were transfected with Effectene-coated latex beads for 30 min and then washed. Live cells were observed at 1-min intervals by fluorescence microscopy. Bar, 3 µm. The time after galectin3 localization was measured for at least 30 cases for each combination (H). Statistical analysis was performed by Student’s unpaired t test. *, P < 0.05; NS, not significant.
Anti Mac2, supplied by Cedarlane, used in various techniques. Bioz Stars score: 93/100, based on 1 PubMed citations. ZERO BIAS - scores, article reviews, protocol conditions and more
https://www.bioz.com/result/anti mac2/product/Cedarlane
Average 93 stars, based on 1 article reviews
anti mac2 - by Bioz Stars, 2026-04
93/100 stars
  Buy from Supplier

Image Search Results


Representative western blot of pSmad2 levels in (A) non-IPF HLFs (N=3) and (B) iHBECs (N=2) pre-treated with S0 μM SB-431S42 (ALKS inhibitor) or 1 μM GB0139 (galectin-3 inhibitor) for 20 minutes prior to 2-hour treatment with 10 μg/mL galectin-3 or 2 ng/mL TGF-β1. Western blot bands were quantified using densitometry analysis and presented as a ratio of pSmad2/tSmad2.

Journal: bioRxiv

Article Title: Defining the mechanism of galectin-3-mediated TGF-β1 activation and its role in lung fibrosis

doi: 10.1101/2023.10.11.561855

Figure Lengend Snippet: Representative western blot of pSmad2 levels in (A) non-IPF HLFs (N=3) and (B) iHBECs (N=2) pre-treated with S0 μM SB-431S42 (ALKS inhibitor) or 1 μM GB0139 (galectin-3 inhibitor) for 20 minutes prior to 2-hour treatment with 10 μg/mL galectin-3 or 2 ng/mL TGF-β1. Western blot bands were quantified using densitometry analysis and presented as a ratio of pSmad2/tSmad2.

Article Snippet: After serum starvation, cells were stimulated with either 10 μg/mL recombinant human galectin-3 protein (R&D Systems) or 2 ng/mL recombinant human TGF-β1 protein (R&D Systems) for 2 hours or S0 μM LPA (Sigma-Aldrich) for 4 hours.

Techniques: Western Blot

Representative western blots of pSmad2 levels in non-IPF HLFs pre-treated with (A) NOTT199SS β1 inhibitor (0.1-100 nM) or (B-D) galectin-3 inhibitors GB0139, GB1107 and GB1211 (1 μM) or GB0149 (0.1-10 μM) for 20 minutes prior to stimulation with 2 ng/mL TGF-β1 (2-hour) or 50 μM LPA (4-hour). Cells pre-treated with S0 μM SB-431542 (ALK5 inhibitor) were included as a control demonstrating maximal inhibition of pSmad2 signaling. Western blot bands were quantified using densitometry analysis and presented as a ratio of pSmad2/tSmad2.

Journal: bioRxiv

Article Title: Defining the mechanism of galectin-3-mediated TGF-β1 activation and its role in lung fibrosis

doi: 10.1101/2023.10.11.561855

Figure Lengend Snippet: Representative western blots of pSmad2 levels in non-IPF HLFs pre-treated with (A) NOTT199SS β1 inhibitor (0.1-100 nM) or (B-D) galectin-3 inhibitors GB0139, GB1107 and GB1211 (1 μM) or GB0149 (0.1-10 μM) for 20 minutes prior to stimulation with 2 ng/mL TGF-β1 (2-hour) or 50 μM LPA (4-hour). Cells pre-treated with S0 μM SB-431542 (ALK5 inhibitor) were included as a control demonstrating maximal inhibition of pSmad2 signaling. Western blot bands were quantified using densitometry analysis and presented as a ratio of pSmad2/tSmad2.

Article Snippet: After serum starvation, cells were stimulated with either 10 μg/mL recombinant human galectin-3 protein (R&D Systems) or 2 ng/mL recombinant human TGF-β1 protein (R&D Systems) for 2 hours or S0 μM LPA (Sigma-Aldrich) for 4 hours.

Techniques: Western Blot, Inhibition

Soluble galectin-3 (sequential injections, 19.5 - 5000 nM) binding to glycosylated or deglycosylated αv integrins: (A) αvβ1, (B) αvβS and (C) αvβ6 immobilised on the surface of a Series S sensor chip CM5 (approximately 1000 RU). (D) Soluble galectin-3 (sequential injections, 156.3-20000 nM) binding to glycosylated or deglycosylated TGFβRII immobilised to a Series S sensor chip CMS (approximately 400 RU). SPR signals were measured in RU and all sensorgrams baseline-corrected. Binding response values plotted in GraphPad Prism with connecting line/curve shown.

Journal: bioRxiv

Article Title: Defining the mechanism of galectin-3-mediated TGF-β1 activation and its role in lung fibrosis

doi: 10.1101/2023.10.11.561855

Figure Lengend Snippet: Soluble galectin-3 (sequential injections, 19.5 - 5000 nM) binding to glycosylated or deglycosylated αv integrins: (A) αvβ1, (B) αvβS and (C) αvβ6 immobilised on the surface of a Series S sensor chip CM5 (approximately 1000 RU). (D) Soluble galectin-3 (sequential injections, 156.3-20000 nM) binding to glycosylated or deglycosylated TGFβRII immobilised to a Series S sensor chip CMS (approximately 400 RU). SPR signals were measured in RU and all sensorgrams baseline-corrected. Binding response values plotted in GraphPad Prism with connecting line/curve shown.

Article Snippet: After serum starvation, cells were stimulated with either 10 μg/mL recombinant human galectin-3 protein (R&D Systems) or 2 ng/mL recombinant human TGF-β1 protein (R&D Systems) for 2 hours or S0 μM LPA (Sigma-Aldrich) for 4 hours.

Techniques: Binding Assay

Solution competition binding assays performed with the galectin-3 inhibitor GB0139 (blue) or GB1107 (black) for αv integrins: (A) αvβ1, (B) αvβS and (C) αvβ6 or (D) TGFβRII in the presence of galectin-3 at 625 nM. Response values are normalised with respect to the highest binding response (DMSO control) and competitive inhibition graphs plotted in GraphPad Prism. IC50 values were calculated by non-linear regression analysis (binding saturation) - specific binding with hill slope.

Journal: bioRxiv

Article Title: Defining the mechanism of galectin-3-mediated TGF-β1 activation and its role in lung fibrosis

doi: 10.1101/2023.10.11.561855

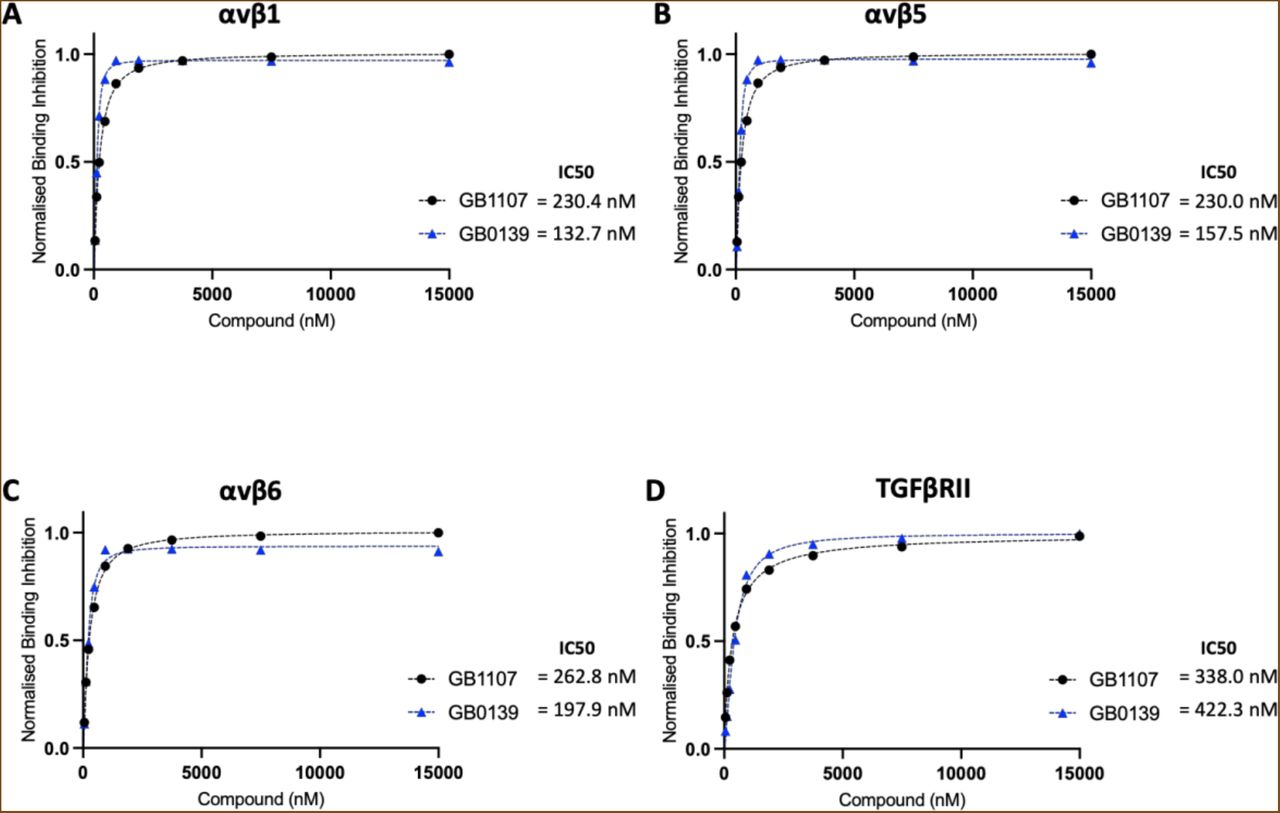
Figure Lengend Snippet: Solution competition binding assays performed with the galectin-3 inhibitor GB0139 (blue) or GB1107 (black) for αv integrins: (A) αvβ1, (B) αvβS and (C) αvβ6 or (D) TGFβRII in the presence of galectin-3 at 625 nM. Response values are normalised with respect to the highest binding response (DMSO control) and competitive inhibition graphs plotted in GraphPad Prism. IC50 values were calculated by non-linear regression analysis (binding saturation) - specific binding with hill slope.

Article Snippet: After serum starvation, cells were stimulated with either 10 μg/mL recombinant human galectin-3 protein (R&D Systems) or 2 ng/mL recombinant human TGF-β1 protein (R&D Systems) for 2 hours or S0 μM LPA (Sigma-Aldrich) for 4 hours.

Techniques: Binding Assay, Inhibition

Representative western blots showing co-immunoprecipitation of galectin-3 and the β1 integrin. Whole-cell protein lysates (6S0 μg/ IP reaction) from untreated non-IPF HLFs p6 (N=3) were immunoprecipitated with an anti-β1 integrin antibody (10 μg/ IP reaction) and immunoblotted for galectin-3 (upper panel) or immunoprecipitated with an anti-galectin-3 antibody (10 μg/ IP reaction) and immunoblotted for the β1 integrin (lower panel). Co-IP input, FT and wash steps loaded as controls. Proteins separated by reducing SDS-PAGE and target protein size estimated from the marker migration pattern.

Journal: bioRxiv

Article Title: Defining the mechanism of galectin-3-mediated TGF-β1 activation and its role in lung fibrosis

doi: 10.1101/2023.10.11.561855

Figure Lengend Snippet: Representative western blots showing co-immunoprecipitation of galectin-3 and the β1 integrin. Whole-cell protein lysates (6S0 μg/ IP reaction) from untreated non-IPF HLFs p6 (N=3) were immunoprecipitated with an anti-β1 integrin antibody (10 μg/ IP reaction) and immunoblotted for galectin-3 (upper panel) or immunoprecipitated with an anti-galectin-3 antibody (10 μg/ IP reaction) and immunoblotted for the β1 integrin (lower panel). Co-IP input, FT and wash steps loaded as controls. Proteins separated by reducing SDS-PAGE and target protein size estimated from the marker migration pattern.

Article Snippet: After serum starvation, cells were stimulated with either 10 μg/mL recombinant human galectin-3 protein (R&D Systems) or 2 ng/mL recombinant human TGF-β1 protein (R&D Systems) for 2 hours or S0 μM LPA (Sigma-Aldrich) for 4 hours.

Techniques: Western Blot, Immunoprecipitation, Co-Immunoprecipitation Assay, SDS Page, Marker, Migration

Representative confocal microscopy images (63x magnification) showing PLA of galectin-3 and the β1 integrin in (A) non-IPF HLFs p3-4 (N=3) or (B) IPF HLFs p3 (N=4) in the absence or presence of TGF-β1 stimulation (2 ng/mL TGF-β1 for 24 hours). Cells probed with a mouse anti-β1 integrin primary antibody (S μg/mL) and a rabbit anti-galectin-3 primary antibody (S μg/mL) followed by anti-rabbit PLUS and anti-mouse MINUS probes. Colocalization of galectin-3 and the β1 integrin 40 nm indicated by red fluorescence with DAPI counterstaining (blue).

Journal: bioRxiv

Article Title: Defining the mechanism of galectin-3-mediated TGF-β1 activation and its role in lung fibrosis

doi: 10.1101/2023.10.11.561855

Figure Lengend Snippet: Representative confocal microscopy images (63x magnification) showing PLA of galectin-3 and the β1 integrin in (A) non-IPF HLFs p3-4 (N=3) or (B) IPF HLFs p3 (N=4) in the absence or presence of TGF-β1 stimulation (2 ng/mL TGF-β1 for 24 hours). Cells probed with a mouse anti-β1 integrin primary antibody (S μg/mL) and a rabbit anti-galectin-3 primary antibody (S μg/mL) followed by anti-rabbit PLUS and anti-mouse MINUS probes. Colocalization of galectin-3 and the β1 integrin 40 nm indicated by red fluorescence with DAPI counterstaining (blue).

Article Snippet: After serum starvation, cells were stimulated with either 10 μg/mL recombinant human galectin-3 protein (R&D Systems) or 2 ng/mL recombinant human TGF-β1 protein (R&D Systems) for 2 hours or S0 μM LPA (Sigma-Aldrich) for 4 hours.

Techniques: Confocal Microscopy, Fluorescence

(A) Downstream signaling of TGF-β1 following its integrin-mediated activation requires the integrin and TGF-β1 receptor to be in close proximity on the cell surface. (B) The galectin-3 carbohydrate binding domain binds to the glycosylation sites on αv integrins and the TGF-β1 receptor forming a galectin lattice at the cell surface which facilitates receptor clustering. This scaffold ensures that TGF-β1 can act on its receptor and potentiates TGF-β1 signaling. GB0139 binds to the galectin-3 carbohydrate recognition domain and blocks these protein-glycan interactions.

Journal: bioRxiv

Article Title: Defining the mechanism of galectin-3-mediated TGF-β1 activation and its role in lung fibrosis

doi: 10.1101/2023.10.11.561855

Figure Lengend Snippet: (A) Downstream signaling of TGF-β1 following its integrin-mediated activation requires the integrin and TGF-β1 receptor to be in close proximity on the cell surface. (B) The galectin-3 carbohydrate binding domain binds to the glycosylation sites on αv integrins and the TGF-β1 receptor forming a galectin lattice at the cell surface which facilitates receptor clustering. This scaffold ensures that TGF-β1 can act on its receptor and potentiates TGF-β1 signaling. GB0139 binds to the galectin-3 carbohydrate recognition domain and blocks these protein-glycan interactions.

Article Snippet: After serum starvation, cells were stimulated with either 10 μg/mL recombinant human galectin-3 protein (R&D Systems) or 2 ng/mL recombinant human TGF-β1 protein (R&D Systems) for 2 hours or S0 μM LPA (Sigma-Aldrich) for 4 hours.

Techniques: Activation Assay, Binding Assay

Identification of DEPs and DEGs by proteomic and transcriptome analysis of the aortas of ApoE −/− mice versus HFD‐fed ApoE −/− mice. (A) Volcano plot analysis represents the up‐ or downregulated DEPs abundance changes in the aortas from ApoE −/− mice versus HFD‐fed ApoE −/− mice. Blue indicates upregulated genes, green indicates downregulated genes, and grey indicates genes with unchanged genes. (B) The top six upregulated DEPs consisting of lgals3/galectin‐3, nucb2, ighm, vcam1, serpina1e and serpina3n between ApoE −/− mice and HFD‐fed ApoE −/− mice. (C) Numbers of DEGs are enriched in the identified pathway. Apoptosis is identified as the critical cell death forms. The x ‐axis represents the number of enriched genes, and the y ‐axis represents the name of the enriched KEGG pathway. (D) Compared to ApoE −/− mice, the gene set upregulated in HFD‐fed ApoE −/− mice is enriched in the signal pathways including foal adhesion, leukocyte transendothelial migration, Toll‐like receptor signalling pathway, natural killer cell mediated cytotoxicity, and apoptosis. (E) The Volcano plot illustrates that gene transcripts with a log2 fold change greater than 1 and a significant p ‐value less than.05 are differently expressed between normal and atherosclerosis. Red represents upregulation, blue represents downregulation, and grey represents no change. (F) KEGG enrichment of DEGs indicates that apoptosis emerged as the fifth pathway of significant alteration. KEGG pathway analysis is performed with bar plot. Colours correspond to the p ‐value, with red indicates more significant enrichment. (G) Venn diagram is performed to screen out the overlapping DEPs and DEGs. (H) The coordinated DEPs and DEGs, consisting of Galectin/Lgals3, Vcam1 and Ctss, are differentially expressed between ApoE −/− control mice and HFD‐fed ApoE −/− mice.

Journal: Clinical and Translational Medicine

Article Title: Macrophage‐derived galectin‐3 contributes to pyroptosis, apoptosis and necroptosis through TLR4/MyD88/NF‐κB/NLRP3 during atherosclerosis

doi: 10.1002/ctm2.70637

Figure Lengend Snippet: Identification of DEPs and DEGs by proteomic and transcriptome analysis of the aortas of ApoE −/− mice versus HFD‐fed ApoE −/− mice. (A) Volcano plot analysis represents the up‐ or downregulated DEPs abundance changes in the aortas from ApoE −/− mice versus HFD‐fed ApoE −/− mice. Blue indicates upregulated genes, green indicates downregulated genes, and grey indicates genes with unchanged genes. (B) The top six upregulated DEPs consisting of lgals3/galectin‐3, nucb2, ighm, vcam1, serpina1e and serpina3n between ApoE −/− mice and HFD‐fed ApoE −/− mice. (C) Numbers of DEGs are enriched in the identified pathway. Apoptosis is identified as the critical cell death forms. The x ‐axis represents the number of enriched genes, and the y ‐axis represents the name of the enriched KEGG pathway. (D) Compared to ApoE −/− mice, the gene set upregulated in HFD‐fed ApoE −/− mice is enriched in the signal pathways including foal adhesion, leukocyte transendothelial migration, Toll‐like receptor signalling pathway, natural killer cell mediated cytotoxicity, and apoptosis. (E) The Volcano plot illustrates that gene transcripts with a log2 fold change greater than 1 and a significant p ‐value less than.05 are differently expressed between normal and atherosclerosis. Red represents upregulation, blue represents downregulation, and grey represents no change. (F) KEGG enrichment of DEGs indicates that apoptosis emerged as the fifth pathway of significant alteration. KEGG pathway analysis is performed with bar plot. Colours correspond to the p ‐value, with red indicates more significant enrichment. (G) Venn diagram is performed to screen out the overlapping DEPs and DEGs. (H) The coordinated DEPs and DEGs, consisting of Galectin/Lgals3, Vcam1 and Ctss, are differentially expressed between ApoE −/− control mice and HFD‐fed ApoE −/− mice.

Article Snippet: Membranes were then incubated overnight on a shaker with primary mouse or rabbit antibodies against galectin‐3 (60207‐1‐Ig, Proteintech, China), GSDMD (AF4012, Affinity Biosciences, China), NLRP3 (DF7438, Affinity Biosciences, China), caspase‐3 (66470‐2‐lg, Proteintech, China), caspase‐8 (66093‐1‐Ig, Proteintech, China), RIPK3 (A5431, ABclonal, China), MLKL (A26436, ABclonal, China), Phospho‐MLKL (AP0949, ABclonal, China), TLR4 (GB11519, Servicebio, China), MyD88 (GB12269, Servicebio, China), NF‐κB (10745‐1‐AP, Proteintech, China), Phospho‐NF‐κB ( GB113882 , Servicebio, China) and GAPDH (60004‐1‐Ig, Proteintech, China).

Techniques: Migration, Control

Molecular classification of human carotid atherosclerotic database based on PANoptosis‐related genes. (A) The CDF curves of consensus matrix for k = 2–5 are illustrated using distinct colours. K value represented the number of clusters. (B) The line graph of CDF area under curve is depicted at k = 2–5. The curve area with minimal variation is between k = 2 and k = 1, thus the clustering effect is relatively stable when k = 2. (C) Given that consensus matrix with k = 2 is an optimal choice, the entire cohort is separated into two clusters. (D) Item consensus plot when k = 2 indicates that the cluster pattern shared the acceptable level of purity in both clusters. (E) The distribution of immune, stromal and overall ESTIMATE scores is inferred by ESTIMATE algorithm between two clusters in the GSE111782 cohort, and three kinds of scores are substantially greater in Cluster 1 than Cluster 2. (F) The infiltration abundance of macrophage subsets is evaluated by CIBERSORT algorithm for two clusters, and Cluster 1 had a greater proportion of macrophage M1 and M2 than Cluster 2. (G) Landscape of PANoptosis‐related gene expression is depicted in Cluster 1 and Cluster 2. (H) KEGG enrichment of all DEGs shows the top 10 signalling pathways. The colour and size of each bubble indicate p ‐value and gene count, respectively. (I) Landscape of three overlapping DEGs and DEPs, including Lgals3/galectin‐3, Vcam1 and Ctss is depicted in Cluster 1 and Cluster 2. Three key DEGs and DEPs are predicted to be activated in Cluster 1 compared to Cluster 2. (J) A PPI network of the three DEGs and DEPs, and 11 PANoptosis‐related genes is created according to the STRING database.

Journal: Clinical and Translational Medicine

Article Title: Macrophage‐derived galectin‐3 contributes to pyroptosis, apoptosis and necroptosis through TLR4/MyD88/NF‐κB/NLRP3 during atherosclerosis

doi: 10.1002/ctm2.70637

Figure Lengend Snippet: Molecular classification of human carotid atherosclerotic database based on PANoptosis‐related genes. (A) The CDF curves of consensus matrix for k = 2–5 are illustrated using distinct colours. K value represented the number of clusters. (B) The line graph of CDF area under curve is depicted at k = 2–5. The curve area with minimal variation is between k = 2 and k = 1, thus the clustering effect is relatively stable when k = 2. (C) Given that consensus matrix with k = 2 is an optimal choice, the entire cohort is separated into two clusters. (D) Item consensus plot when k = 2 indicates that the cluster pattern shared the acceptable level of purity in both clusters. (E) The distribution of immune, stromal and overall ESTIMATE scores is inferred by ESTIMATE algorithm between two clusters in the GSE111782 cohort, and three kinds of scores are substantially greater in Cluster 1 than Cluster 2. (F) The infiltration abundance of macrophage subsets is evaluated by CIBERSORT algorithm for two clusters, and Cluster 1 had a greater proportion of macrophage M1 and M2 than Cluster 2. (G) Landscape of PANoptosis‐related gene expression is depicted in Cluster 1 and Cluster 2. (H) KEGG enrichment of all DEGs shows the top 10 signalling pathways. The colour and size of each bubble indicate p ‐value and gene count, respectively. (I) Landscape of three overlapping DEGs and DEPs, including Lgals3/galectin‐3, Vcam1 and Ctss is depicted in Cluster 1 and Cluster 2. Three key DEGs and DEPs are predicted to be activated in Cluster 1 compared to Cluster 2. (J) A PPI network of the three DEGs and DEPs, and 11 PANoptosis‐related genes is created according to the STRING database.

Article Snippet: Membranes were then incubated overnight on a shaker with primary mouse or rabbit antibodies against galectin‐3 (60207‐1‐Ig, Proteintech, China), GSDMD (AF4012, Affinity Biosciences, China), NLRP3 (DF7438, Affinity Biosciences, China), caspase‐3 (66470‐2‐lg, Proteintech, China), caspase‐8 (66093‐1‐Ig, Proteintech, China), RIPK3 (A5431, ABclonal, China), MLKL (A26436, ABclonal, China), Phospho‐MLKL (AP0949, ABclonal, China), TLR4 (GB11519, Servicebio, China), MyD88 (GB12269, Servicebio, China), NF‐κB (10745‐1‐AP, Proteintech, China), Phospho‐NF‐κB ( GB113882 , Servicebio, China) and GAPDH (60004‐1‐Ig, Proteintech, China).

Techniques: Gene Expression

Galectin‐3 expression is abundant in human and mouse atherosclerotic lesions. (A) Ten main cell types are visualised in atherosclerotic core (AC) and proximal adjacent (PA) tissues by tSNE (t‐distributed stochastic neighbour embedding). (B) The macrophage population significantly increased in AC relative to PA. (C) Biaxial scatter plots show the expression pattern of galectin‐3 in total cell types between AC and PA. The colour scale represents expression levels in biaxial scatter plots (grey: low; pink: high). (D) Galectin‐3‐positive macrophages expanded in AC in comparison with PA. (E) Five macrophage subtypes are visualised in AC and PA tissues by tSNE. (F) My.0 and My.1 account for 34.1% and 47.6% of macrophages in AC, respectively. My.2 significantly increased in AC relative to PA. (G) Biaxial scatter plots exhibit the expression pattern of galectin‐3 in macrophage subtypes between AC and PA. (H) Galectin‐3‐positive My.0 and My.1 account for 35.8% and 47.5% of galectin‐3‐positive macrophages in AC, respectively. Galectin‐3‐positive My.2 expands in AC in comparison with PA. (I) Representative Western blots and relative quantitative analysis of galectin‐3 in human atherosclerotic lesions and peripheral normal artery. (J) Triple immunofluorescence staining for galectin‐3 (red), NLRP3 (green), CD68 (pink) and DAPI (blue) in human atherosclerosis and peripheral normal artery reveals the colocalisation of galectin‐3 and NLRP3 in CD68‐positive macrophages. Scale bar: 50 µm. (K) Representative Western blots and relative quantitative analysis of galectin‐3 in the aortas of ApoE −/− mice fed with an HFD or normal diet. (L) Triple immunofluorescence staining for galectin‐3 (red), NLRP3 (green), CD68 (pink) and DAPI (blue) in human atherosclerosis and peripheral normal artery reveals that galectin‐3 and NLRP3 are colocalised in CD68‐positive macrophages. Scale bar: 50 µm. (M) Cell lysates from ox‐LDL‐treated macrophages are immuno‐precipitated with anti‐galectin‐3 or anti‐NLRP3 antibodies, and blotted with anti‐NLRP3 or anti‐galectin‐3 antibodies. Data are derived from three to five independent experiments. * p ˂.05, ** p ˂.01, *** p ˂.001 by Student's t test. ns: not significant.

Journal: Clinical and Translational Medicine

Article Title: Macrophage‐derived galectin‐3 contributes to pyroptosis, apoptosis and necroptosis through TLR4/MyD88/NF‐κB/NLRP3 during atherosclerosis

doi: 10.1002/ctm2.70637

Figure Lengend Snippet: Galectin‐3 expression is abundant in human and mouse atherosclerotic lesions. (A) Ten main cell types are visualised in atherosclerotic core (AC) and proximal adjacent (PA) tissues by tSNE (t‐distributed stochastic neighbour embedding). (B) The macrophage population significantly increased in AC relative to PA. (C) Biaxial scatter plots show the expression pattern of galectin‐3 in total cell types between AC and PA. The colour scale represents expression levels in biaxial scatter plots (grey: low; pink: high). (D) Galectin‐3‐positive macrophages expanded in AC in comparison with PA. (E) Five macrophage subtypes are visualised in AC and PA tissues by tSNE. (F) My.0 and My.1 account for 34.1% and 47.6% of macrophages in AC, respectively. My.2 significantly increased in AC relative to PA. (G) Biaxial scatter plots exhibit the expression pattern of galectin‐3 in macrophage subtypes between AC and PA. (H) Galectin‐3‐positive My.0 and My.1 account for 35.8% and 47.5% of galectin‐3‐positive macrophages in AC, respectively. Galectin‐3‐positive My.2 expands in AC in comparison with PA. (I) Representative Western blots and relative quantitative analysis of galectin‐3 in human atherosclerotic lesions and peripheral normal artery. (J) Triple immunofluorescence staining for galectin‐3 (red), NLRP3 (green), CD68 (pink) and DAPI (blue) in human atherosclerosis and peripheral normal artery reveals the colocalisation of galectin‐3 and NLRP3 in CD68‐positive macrophages. Scale bar: 50 µm. (K) Representative Western blots and relative quantitative analysis of galectin‐3 in the aortas of ApoE −/− mice fed with an HFD or normal diet. (L) Triple immunofluorescence staining for galectin‐3 (red), NLRP3 (green), CD68 (pink) and DAPI (blue) in human atherosclerosis and peripheral normal artery reveals that galectin‐3 and NLRP3 are colocalised in CD68‐positive macrophages. Scale bar: 50 µm. (M) Cell lysates from ox‐LDL‐treated macrophages are immuno‐precipitated with anti‐galectin‐3 or anti‐NLRP3 antibodies, and blotted with anti‐NLRP3 or anti‐galectin‐3 antibodies. Data are derived from three to five independent experiments. * p ˂.05, ** p ˂.01, *** p ˂.001 by Student's t test. ns: not significant.

Article Snippet: Membranes were then incubated overnight on a shaker with primary mouse or rabbit antibodies against galectin‐3 (60207‐1‐Ig, Proteintech, China), GSDMD (AF4012, Affinity Biosciences, China), NLRP3 (DF7438, Affinity Biosciences, China), caspase‐3 (66470‐2‐lg, Proteintech, China), caspase‐8 (66093‐1‐Ig, Proteintech, China), RIPK3 (A5431, ABclonal, China), MLKL (A26436, ABclonal, China), Phospho‐MLKL (AP0949, ABclonal, China), TLR4 (GB11519, Servicebio, China), MyD88 (GB12269, Servicebio, China), NF‐κB (10745‐1‐AP, Proteintech, China), Phospho‐NF‐κB ( GB113882 , Servicebio, China) and GAPDH (60004‐1‐Ig, Proteintech, China).

Techniques: Expressing, Comparison, Western Blot, Immunofluorescence, Staining, Derivative Assay

Gene Oncology (GO), Kyoto Encyclopedia of Genes and Genomes (KEGG), and gene set enrichment analysis (GSEA) of differentially expressed genes (DEGs) in macrophage between atherosclerotic core (AC) and proximal adjacent (PA) tissues. (A) Volcano plot of DEGs in macrophages is conducted between PA and AC. Lgals3/galectin‐3 are identified as a critical DEG expressed in macrophages. (B) Enriched GO terms are depicted with DEGs in macrophages, including necroptotic signalling pathway, pyroptotic inflammatory response, regulation of apoptotic signalling pathway, MyD88‐dependent Toll‐like receptor 4 signalling pathway, and canonical NF‐kappyB signal transduction, and so forth. (C) KEGG analysis is conducted using DEGs in macrophages, including fluid shear stress and atherosclerosis, leukocyte transendothelial migration, pyroptosis, lipid and atherosclerosis, necroptosis, Toll‐like receptor signalling pathway, NF‐kB signalling, and apoptosis. The x ‐axis corresponds to the number of enriched DEGs, and the y ‐axis corresponds to the enriched pathway. Colours indicate the p ‐values, with red more significant enrichment. (D–F) Gene set of pyroptosis, apoptosis, necroptosis, NF‐kB signalling pathway, Toll‐like receptor signalling pathway, leukocyte transendothelial migration, lipid and atherosclerosis, and fluid shear stress and atherosclerosis are significantly upregulated in macrophages during atherosclerosis.

Journal: Clinical and Translational Medicine

Article Title: Macrophage‐derived galectin‐3 contributes to pyroptosis, apoptosis and necroptosis through TLR4/MyD88/NF‐κB/NLRP3 during atherosclerosis

doi: 10.1002/ctm2.70637

Figure Lengend Snippet: Gene Oncology (GO), Kyoto Encyclopedia of Genes and Genomes (KEGG), and gene set enrichment analysis (GSEA) of differentially expressed genes (DEGs) in macrophage between atherosclerotic core (AC) and proximal adjacent (PA) tissues. (A) Volcano plot of DEGs in macrophages is conducted between PA and AC. Lgals3/galectin‐3 are identified as a critical DEG expressed in macrophages. (B) Enriched GO terms are depicted with DEGs in macrophages, including necroptotic signalling pathway, pyroptotic inflammatory response, regulation of apoptotic signalling pathway, MyD88‐dependent Toll‐like receptor 4 signalling pathway, and canonical NF‐kappyB signal transduction, and so forth. (C) KEGG analysis is conducted using DEGs in macrophages, including fluid shear stress and atherosclerosis, leukocyte transendothelial migration, pyroptosis, lipid and atherosclerosis, necroptosis, Toll‐like receptor signalling pathway, NF‐kB signalling, and apoptosis. The x ‐axis corresponds to the number of enriched DEGs, and the y ‐axis corresponds to the enriched pathway. Colours indicate the p ‐values, with red more significant enrichment. (D–F) Gene set of pyroptosis, apoptosis, necroptosis, NF‐kB signalling pathway, Toll‐like receptor signalling pathway, leukocyte transendothelial migration, lipid and atherosclerosis, and fluid shear stress and atherosclerosis are significantly upregulated in macrophages during atherosclerosis.

Article Snippet: Membranes were then incubated overnight on a shaker with primary mouse or rabbit antibodies against galectin‐3 (60207‐1‐Ig, Proteintech, China), GSDMD (AF4012, Affinity Biosciences, China), NLRP3 (DF7438, Affinity Biosciences, China), caspase‐3 (66470‐2‐lg, Proteintech, China), caspase‐8 (66093‐1‐Ig, Proteintech, China), RIPK3 (A5431, ABclonal, China), MLKL (A26436, ABclonal, China), Phospho‐MLKL (AP0949, ABclonal, China), TLR4 (GB11519, Servicebio, China), MyD88 (GB12269, Servicebio, China), NF‐κB (10745‐1‐AP, Proteintech, China), Phospho‐NF‐κB ( GB113882 , Servicebio, China) and GAPDH (60004‐1‐Ig, Proteintech, China).

Techniques: Transduction, Shear, Migration

Silencing galectin‐3 downregulated TLR4/MyD88/NF‐kB expression and attenuated ox‐LDL induced pyroptotic, apoptotic, and necroptotic cell death in macrophages. (A) Electron microscopy ultrastructural analysis of control and ox‐LDL‐induced macrophages. Control macrophages have a normal‐looking cellular structure, whereas ox‐LDL‐induced macrophages show loss of cell plasma integrity, chromatin condensation or fragmentation, and electron‐light zone. Scale bar: 2.5 µm. (B) Confocal microscopy with double immunofluorescence staining for caspase‐3 (red) and RIPK3 (green) in macrophages show the colocalisation of apoptotic and necroptotic components. Confocal microscopy analysis of double immunofluorescence labelling is indicative of overlapping expression of caspase‐3 (red) and GSDMD (green) in macrophages. Scale bar: 25 µm. (C) Representative Western blots and relative quantitative analysis of galectin‐3 in control macrophages and cells treated with ox‐LDL, ox‐LDL plus siControl RNA, and ox‐LDL plus siGalectin‐3 RNA. (D and E) Flow cytometry (E) and quantification analysis (F) with annexin V/PI double staining show that ox‐LDL increased the percentage of apoptotic cells in macrophages, which is alleviated by silencing galectin‐3. (F–H) Flow cytometry (F) and quantification analysis (G) with PI/Hoechst staining (H) show that ox‐LDL enhanced PI uptake in macrophages, which is markedly blocked by silencing galectin‐3. Scale bar: 50 µm. (I) Silencing galectin‐3 abrogated LDH release in macrophages ignited by ox‐LDL. (J) Ox‐LDL induced the accumulation of intracellular lipid droplets in macrophages, which are potently reversed by silencing galectin‐3. Scale bar: 50 µm. (K) Representative Western blots and relative quantitative analysis of NLRP3, GSDMD and GSDMD‐N in control macrophages and cells treated with ox‐LDL, ox‐LDL plus siControl RNA, and ox‐LDL plus siGalectin‐3 RNA. (L) Representative Western blots and relative quantitative analysis of caspase‐3, cleaved caspase‐3, caspase‐8 and cleaved caspase‐8 in control macrophages and cells treated with ox‐LDL, ox‐LDL plus siControl RNA, and ox‐LDL plus siGalectin‐3 RNA. (M and N) Representative Western blots and relative quantitative analysis of RIPK3, MLKL and phospho‐MLKL in control macrophages and cells treated with ox‐LDL, ox‐LDL plus siControl RNA, and ox‐LDL plus siGalectin‐3 RNA. (O) Ox‐LDL treatment promotes the release of proinflammatory cytokines (TNF‐1α, IL‐1β, IL‐18 and IL‐6) from macrophages, which is markedly rescued by silencing galectin‐3. (P and Q) Representative Western blots and relative quantitative analysis of TLR4, MyD88, NF‐kB and phospho‐NF‐kB in control macrophages and cells treated with ox‐LDL, ox‐LDL plus siControl RNA, and ox‐LDL plus siGalectin‐3 RNA. (R) Cell lysates from ox‐LDL‐treated macrophages are immunoprecipitated with anti‐TLR4 or anti‐MyD88 antibodies, and blotted with anti‐TLR4 or anti‐MyD88 antibodies. Data are derived from three to five independent experiments. * p ˂.05, ** p ˂.01, *** p ˂.001 by Student's t test. ns: not significant.

Journal: Clinical and Translational Medicine

Article Title: Macrophage‐derived galectin‐3 contributes to pyroptosis, apoptosis and necroptosis through TLR4/MyD88/NF‐κB/NLRP3 during atherosclerosis

doi: 10.1002/ctm2.70637

Figure Lengend Snippet: Silencing galectin‐3 downregulated TLR4/MyD88/NF‐kB expression and attenuated ox‐LDL induced pyroptotic, apoptotic, and necroptotic cell death in macrophages. (A) Electron microscopy ultrastructural analysis of control and ox‐LDL‐induced macrophages. Control macrophages have a normal‐looking cellular structure, whereas ox‐LDL‐induced macrophages show loss of cell plasma integrity, chromatin condensation or fragmentation, and electron‐light zone. Scale bar: 2.5 µm. (B) Confocal microscopy with double immunofluorescence staining for caspase‐3 (red) and RIPK3 (green) in macrophages show the colocalisation of apoptotic and necroptotic components. Confocal microscopy analysis of double immunofluorescence labelling is indicative of overlapping expression of caspase‐3 (red) and GSDMD (green) in macrophages. Scale bar: 25 µm. (C) Representative Western blots and relative quantitative analysis of galectin‐3 in control macrophages and cells treated with ox‐LDL, ox‐LDL plus siControl RNA, and ox‐LDL plus siGalectin‐3 RNA. (D and E) Flow cytometry (E) and quantification analysis (F) with annexin V/PI double staining show that ox‐LDL increased the percentage of apoptotic cells in macrophages, which is alleviated by silencing galectin‐3. (F–H) Flow cytometry (F) and quantification analysis (G) with PI/Hoechst staining (H) show that ox‐LDL enhanced PI uptake in macrophages, which is markedly blocked by silencing galectin‐3. Scale bar: 50 µm. (I) Silencing galectin‐3 abrogated LDH release in macrophages ignited by ox‐LDL. (J) Ox‐LDL induced the accumulation of intracellular lipid droplets in macrophages, which are potently reversed by silencing galectin‐3. Scale bar: 50 µm. (K) Representative Western blots and relative quantitative analysis of NLRP3, GSDMD and GSDMD‐N in control macrophages and cells treated with ox‐LDL, ox‐LDL plus siControl RNA, and ox‐LDL plus siGalectin‐3 RNA. (L) Representative Western blots and relative quantitative analysis of caspase‐3, cleaved caspase‐3, caspase‐8 and cleaved caspase‐8 in control macrophages and cells treated with ox‐LDL, ox‐LDL plus siControl RNA, and ox‐LDL plus siGalectin‐3 RNA. (M and N) Representative Western blots and relative quantitative analysis of RIPK3, MLKL and phospho‐MLKL in control macrophages and cells treated with ox‐LDL, ox‐LDL plus siControl RNA, and ox‐LDL plus siGalectin‐3 RNA. (O) Ox‐LDL treatment promotes the release of proinflammatory cytokines (TNF‐1α, IL‐1β, IL‐18 and IL‐6) from macrophages, which is markedly rescued by silencing galectin‐3. (P and Q) Representative Western blots and relative quantitative analysis of TLR4, MyD88, NF‐kB and phospho‐NF‐kB in control macrophages and cells treated with ox‐LDL, ox‐LDL plus siControl RNA, and ox‐LDL plus siGalectin‐3 RNA. (R) Cell lysates from ox‐LDL‐treated macrophages are immunoprecipitated with anti‐TLR4 or anti‐MyD88 antibodies, and blotted with anti‐TLR4 or anti‐MyD88 antibodies. Data are derived from three to five independent experiments. * p ˂.05, ** p ˂.01, *** p ˂.001 by Student's t test. ns: not significant.

Article Snippet: Membranes were then incubated overnight on a shaker with primary mouse or rabbit antibodies against galectin‐3 (60207‐1‐Ig, Proteintech, China), GSDMD (AF4012, Affinity Biosciences, China), NLRP3 (DF7438, Affinity Biosciences, China), caspase‐3 (66470‐2‐lg, Proteintech, China), caspase‐8 (66093‐1‐Ig, Proteintech, China), RIPK3 (A5431, ABclonal, China), MLKL (A26436, ABclonal, China), Phospho‐MLKL (AP0949, ABclonal, China), TLR4 (GB11519, Servicebio, China), MyD88 (GB12269, Servicebio, China), NF‐κB (10745‐1‐AP, Proteintech, China), Phospho‐NF‐κB ( GB113882 , Servicebio, China) and GAPDH (60004‐1‐Ig, Proteintech, China).

Techniques: Expressing, Electron Microscopy, Control, Clinical Proteomics, Confocal Microscopy, Double Immunofluorescence Staining, Immunofluorescence, Western Blot, Flow Cytometry, Double Staining, Staining, Immunoprecipitation, Derivative Assay

NLRP3 agonist nigericin counteracted the inhibitory effect of silencing galectin‐3 on pyroptosis, apoptosis and necroptosis in macrophages. (A) Confocal microscopy with double immunofluorescence staining for galectin‐3 (red) and NLRP3 (green) in macrophages reveals the colocalisation of galectin‐3 with NLRP3. Scale bar: 25 µm. (B and C) Flow cytometry (B) and quantification analysis (C) with annexin V/PI double staining show that silencing galectin‐3 decreases the percentage of apoptotic cells in ox‐LDL‐induced macrophages, and nigericin robustly blunts the inhibitory effect of siGalectin‐3. (D–F) Flow cytometry (D) and quantification analysis (E) with PI/Hoechst staining (F) show that silencing galectin‐3 diminishes the percentage of PI‐positive cells in ox‐LDL‐induced macrophages, and nigericin mostly abolishes the protective effect of siGalectin‐3. Scale bar: 50 µm. (G) Silencing galectin‐3 suppresses the LDH release in ox‐LDL‐induced macrophages, which is largely abrogated by nigericin. (H) Silencing galectin‐3 lessens the intracellular lipid droplet in ox‐LDL‐induced macrophages, while nigericin exerts the opposite effect. Scale bar: 50 µm. (I) Representative Western blots and relative quantitative analysis of NLRP3, GSDMD and GSDMD‐N in macrophages treated with ox‐LDL, ox‐LDL plus galectin‐3 siRNA, ox‐LDL plus nigericin, and ox‐LDL plus galectin‐3 siRNA plus nigericin. (J) Representative Western blots and relative quantitative analysis of caspase‐3, cleaved caspase‐3, caspase‐8 and cleaved caspase‐8 in macrophages treated with ox‐LDL, ox‐LDL plus galectin‐3 siRNA, ox‐LDL plus nigericin, and ox‐LDL plus galectin‐3 siRNA plus nigericin. (K) The activity of caspase‐3 in macrophages treated with ox‐LDL, ox‐LDL plus galectin‐3 siRNA, ox‐LDL plus nigericin, and ox‐LDL plus galectin‐3 siRNA plus nigericin. (L and M) Representative Western blots and relative quantitative analysis of RIPK3, MLKL and phospho‐MLKL in macrophages treated with ox‐LDL, ox‐LDL plus galectin‐3 siRNA, ox‐LDL plus nigericin, and ox‐LDL plus galectin‐3 siRNA plus nigericin. (N) Silencing galectin‐3 inhibits the release of inflammatory cytokines (TNF‐1α, IL‐1β, IL‐18 and IL‐6) in ox‐LDL‐induced macrophages, and nigericin effectively blocks the role of siGalectin‐3. Data are derived from three to five independent experiments. * p ˂.05, ** p ˂.01, *** p ˂.001 by Student's t test. ns: not significant.

Journal: Clinical and Translational Medicine

Article Title: Macrophage‐derived galectin‐3 contributes to pyroptosis, apoptosis and necroptosis through TLR4/MyD88/NF‐κB/NLRP3 during atherosclerosis

doi: 10.1002/ctm2.70637

Figure Lengend Snippet: NLRP3 agonist nigericin counteracted the inhibitory effect of silencing galectin‐3 on pyroptosis, apoptosis and necroptosis in macrophages. (A) Confocal microscopy with double immunofluorescence staining for galectin‐3 (red) and NLRP3 (green) in macrophages reveals the colocalisation of galectin‐3 with NLRP3. Scale bar: 25 µm. (B and C) Flow cytometry (B) and quantification analysis (C) with annexin V/PI double staining show that silencing galectin‐3 decreases the percentage of apoptotic cells in ox‐LDL‐induced macrophages, and nigericin robustly blunts the inhibitory effect of siGalectin‐3. (D–F) Flow cytometry (D) and quantification analysis (E) with PI/Hoechst staining (F) show that silencing galectin‐3 diminishes the percentage of PI‐positive cells in ox‐LDL‐induced macrophages, and nigericin mostly abolishes the protective effect of siGalectin‐3. Scale bar: 50 µm. (G) Silencing galectin‐3 suppresses the LDH release in ox‐LDL‐induced macrophages, which is largely abrogated by nigericin. (H) Silencing galectin‐3 lessens the intracellular lipid droplet in ox‐LDL‐induced macrophages, while nigericin exerts the opposite effect. Scale bar: 50 µm. (I) Representative Western blots and relative quantitative analysis of NLRP3, GSDMD and GSDMD‐N in macrophages treated with ox‐LDL, ox‐LDL plus galectin‐3 siRNA, ox‐LDL plus nigericin, and ox‐LDL plus galectin‐3 siRNA plus nigericin. (J) Representative Western blots and relative quantitative analysis of caspase‐3, cleaved caspase‐3, caspase‐8 and cleaved caspase‐8 in macrophages treated with ox‐LDL, ox‐LDL plus galectin‐3 siRNA, ox‐LDL plus nigericin, and ox‐LDL plus galectin‐3 siRNA plus nigericin. (K) The activity of caspase‐3 in macrophages treated with ox‐LDL, ox‐LDL plus galectin‐3 siRNA, ox‐LDL plus nigericin, and ox‐LDL plus galectin‐3 siRNA plus nigericin. (L and M) Representative Western blots and relative quantitative analysis of RIPK3, MLKL and phospho‐MLKL in macrophages treated with ox‐LDL, ox‐LDL plus galectin‐3 siRNA, ox‐LDL plus nigericin, and ox‐LDL plus galectin‐3 siRNA plus nigericin. (N) Silencing galectin‐3 inhibits the release of inflammatory cytokines (TNF‐1α, IL‐1β, IL‐18 and IL‐6) in ox‐LDL‐induced macrophages, and nigericin effectively blocks the role of siGalectin‐3. Data are derived from three to five independent experiments. * p ˂.05, ** p ˂.01, *** p ˂.001 by Student's t test. ns: not significant.

Article Snippet: Membranes were then incubated overnight on a shaker with primary mouse or rabbit antibodies against galectin‐3 (60207‐1‐Ig, Proteintech, China), GSDMD (AF4012, Affinity Biosciences, China), NLRP3 (DF7438, Affinity Biosciences, China), caspase‐3 (66470‐2‐lg, Proteintech, China), caspase‐8 (66093‐1‐Ig, Proteintech, China), RIPK3 (A5431, ABclonal, China), MLKL (A26436, ABclonal, China), Phospho‐MLKL (AP0949, ABclonal, China), TLR4 (GB11519, Servicebio, China), MyD88 (GB12269, Servicebio, China), NF‐κB (10745‐1‐AP, Proteintech, China), Phospho‐NF‐κB ( GB113882 , Servicebio, China) and GAPDH (60004‐1‐Ig, Proteintech, China).

Techniques: Confocal Microscopy, Double Immunofluorescence Staining, Flow Cytometry, Double Staining, Staining, Western Blot, Activity Assay, Derivative Assay

Pyroptosis, apoptosis and necroptosis in macrophages coordinately occurred in ApoE −/− mice fed an HFD, which are alleviated by galectin‐3 deficiency, and conversely are aggravated by NLRP3 agonist nigericin. (A) Pyroptosis, apoptosis and necroptosis of macrophages are identified in the aortas of ApoE −/− mice fed an HFD, as evidenced by plasma membrane pore (red arrows), chromatin condensation (red arrows), and electron‐light zone (red arrows) by transmission electron microscopy. Scale bar: 2.5 µm. (B) Triple immunofluorescence staining for GSDMD (green), caspase‐3 (red), RIPK3 (pink) and DAPI (blue) in the aortas of ApoE −/− mice fed HFD or normal diet reveals the potential crosstalk among pyroptosis, apoptosis and necroptosis as evidenced by the colocalisation of GSDMD, caspase‐3 and RIPK3. Three‐positive cells are shown by the arrows. Scale bar: 50 µm. (C–E) Dual immunofluorescence staining for caspase‐3 (C)/GSDMD (D)/RIPK3 (E) (red), F4/80 (green), and DAPI (blue) in the aortas of ApoE −/− mice fed an HFD or normal diet demonstrate that GSDMD/caspase‐3/RIPK3 immunoreactivity colocalises with macrophage marker CD68. Scale bar: 50 µm. (F) Representative Western blots and relative quantitative analysis of NLRP3, GSDMD and GSDMD‐N in the aortas of ApoE −/− mice fed with a normal diet or HFD, NLRP3 agonist nigericin‐treated ApoE −/− mice fed with an HFD, and Galectin‐3 −/− / ApoE −/− mice fed with an HFD. (G) Representative Western blots and relative quantitative analysis of caspase‐3, cleaved caspase‐3, caspase 8 and cleaved caspase 8 in the aortas of ApoE −/− mice fed with a normal diet or HFD, nigericin‐treated ApoE −/− mice fed with HFD, and Galectin‐3 −/− / ApoE −/− mice fed with HFD. (H) The activity of caspase‐3 in the aortas of ApoE −/− mice fed with a normal diet or HFD, nigericin‐treated ApoE −/− mice fed with HFD, and Galectin‐3 −/− / ApoE −/− mice fed with an HFD. (I and J) Representative Western blots and relative quantitative analysis of RIPK3, MLKL and phospho‐MLKL in the aortas of ApoE −/− mice fed with a normal diet or HFD, nigericin‐treated ApoE −/− mice fed with HFD, and Galectin‐3 −/− / ApoE −/− mice fed with an HFD. (K and L) Representative Western blots and relative quantitative analysis of TLR4, MyD88, NF‐κB and phospho‐NF‐κB in the aortas of ApoE −/− mice fed with a normal diet or HFD, nigericin‐treated ApoE −/− mice fed with HFD, and Galectin‐3 −/− / ApoE −/− mice fed with an HFD. n = 4–8 mice per group. * p ˂.05, ** p ˂.01, *** p ˂.001 by Student's t test. ns: not significant.

Journal: Clinical and Translational Medicine

Article Title: Macrophage‐derived galectin‐3 contributes to pyroptosis, apoptosis and necroptosis through TLR4/MyD88/NF‐κB/NLRP3 during atherosclerosis

doi: 10.1002/ctm2.70637

Figure Lengend Snippet: Pyroptosis, apoptosis and necroptosis in macrophages coordinately occurred in ApoE −/− mice fed an HFD, which are alleviated by galectin‐3 deficiency, and conversely are aggravated by NLRP3 agonist nigericin. (A) Pyroptosis, apoptosis and necroptosis of macrophages are identified in the aortas of ApoE −/− mice fed an HFD, as evidenced by plasma membrane pore (red arrows), chromatin condensation (red arrows), and electron‐light zone (red arrows) by transmission electron microscopy. Scale bar: 2.5 µm. (B) Triple immunofluorescence staining for GSDMD (green), caspase‐3 (red), RIPK3 (pink) and DAPI (blue) in the aortas of ApoE −/− mice fed HFD or normal diet reveals the potential crosstalk among pyroptosis, apoptosis and necroptosis as evidenced by the colocalisation of GSDMD, caspase‐3 and RIPK3. Three‐positive cells are shown by the arrows. Scale bar: 50 µm. (C–E) Dual immunofluorescence staining for caspase‐3 (C)/GSDMD (D)/RIPK3 (E) (red), F4/80 (green), and DAPI (blue) in the aortas of ApoE −/− mice fed an HFD or normal diet demonstrate that GSDMD/caspase‐3/RIPK3 immunoreactivity colocalises with macrophage marker CD68. Scale bar: 50 µm. (F) Representative Western blots and relative quantitative analysis of NLRP3, GSDMD and GSDMD‐N in the aortas of ApoE −/− mice fed with a normal diet or HFD, NLRP3 agonist nigericin‐treated ApoE −/− mice fed with an HFD, and Galectin‐3 −/− / ApoE −/− mice fed with an HFD. (G) Representative Western blots and relative quantitative analysis of caspase‐3, cleaved caspase‐3, caspase 8 and cleaved caspase 8 in the aortas of ApoE −/− mice fed with a normal diet or HFD, nigericin‐treated ApoE −/− mice fed with HFD, and Galectin‐3 −/− / ApoE −/− mice fed with HFD. (H) The activity of caspase‐3 in the aortas of ApoE −/− mice fed with a normal diet or HFD, nigericin‐treated ApoE −/− mice fed with HFD, and Galectin‐3 −/− / ApoE −/− mice fed with an HFD. (I and J) Representative Western blots and relative quantitative analysis of RIPK3, MLKL and phospho‐MLKL in the aortas of ApoE −/− mice fed with a normal diet or HFD, nigericin‐treated ApoE −/− mice fed with HFD, and Galectin‐3 −/− / ApoE −/− mice fed with an HFD. (K and L) Representative Western blots and relative quantitative analysis of TLR4, MyD88, NF‐κB and phospho‐NF‐κB in the aortas of ApoE −/− mice fed with a normal diet or HFD, nigericin‐treated ApoE −/− mice fed with HFD, and Galectin‐3 −/− / ApoE −/− mice fed with an HFD. n = 4–8 mice per group. * p ˂.05, ** p ˂.01, *** p ˂.001 by Student's t test. ns: not significant.

Article Snippet: Membranes were then incubated overnight on a shaker with primary mouse or rabbit antibodies against galectin‐3 (60207‐1‐Ig, Proteintech, China), GSDMD (AF4012, Affinity Biosciences, China), NLRP3 (DF7438, Affinity Biosciences, China), caspase‐3 (66470‐2‐lg, Proteintech, China), caspase‐8 (66093‐1‐Ig, Proteintech, China), RIPK3 (A5431, ABclonal, China), MLKL (A26436, ABclonal, China), Phospho‐MLKL (AP0949, ABclonal, China), TLR4 (GB11519, Servicebio, China), MyD88 (GB12269, Servicebio, China), NF‐κB (10745‐1‐AP, Proteintech, China), Phospho‐NF‐κB ( GB113882 , Servicebio, China) and GAPDH (60004‐1‐Ig, Proteintech, China).

Techniques: Clinical Proteomics, Membrane, Transmission Assay, Electron Microscopy, Immunofluorescence, Staining, Marker, Western Blot, Activity Assay

Galectin‐3 genetic deficiency or knockdown reduced and, conversely, NLRP3 agonist nigericin augmented atherosclerotic lesions in HFD‐fed ApoE −/− mice. (A) The knockout efficacy of galectin‐3 in the aorta is verified by Western blotting and RT‐qPCR. (B) Schematic diagram of animal study design. Galectin‐3 −/− /ApoE −/− mice and ApoE −/− mice are fed an HFD for 16 weeks, and ApoE −/− mice are intraperitoneally administered with NLRP3 agonist nigericin. (C) Representative images of en face Oil Red O staining in the entire aortas are obtained from ApoE −/− control mice, HFD‐fed ApoE −/− mice, HFD‐fed ApoE −/− mice treated with nigericin, and HFD‐fed Galectin‐3 −/− /ApoE −/− mice. Scale bar: 50 mm. (D) En face lesion area is quantified as a percentage of the total area of the aorta. Compared with those in HFD‐fed ApoE −/− mice, en face lesion areas are significantly smaller in HFD‐fed Galectin‐3 −/− /ApoE −/− mice and, conversely, are markedly bigger in HFD‐fed ApoE −/− mice treated with nigericin. (E) Representative sections of HE, Oil Red O and Movat's staining in the aortic sinuses are acquired from four different groups of mice. Scale bar: 1 mm. (F) Aortic sinus plaque lesion area, lipid lesion area and mucin area are represented as total area in µm 2 . Plaque area, lipid lesion area (red) and mucin area (blue‐green) are much bigger in HFD‐fed ApoE −/− mice treated with nigericin and, conversely, are relatively smaller in HFD‐fed Galectin‐3 −/− /ApoE −/− mice in comparison with HFD‐fed ApoE −/− mice. (G) The levels of inflammatory cytokines in the aortas are measured from four different groups of mice. (H) Schematic illustration of experimental protocol in ApoE −/− mice receiving the injection of AAV‐F4/80 shGalectin‐3/empty vector at the age of 4 weeks. After 2 weeks of a normal diet for rest, these mice are treated with HFD for 16 weeks. (I) The knockdown efficacy of shGalectin‐3 in the aorta is confirmed through Western blotting and RT‐qPCR. (J) Representative images of en face Oil Red O staining in the entire aortas are obtained from HFD‐fed ApoE −/− mice, empty vector‐treated HFD‐fed ApoE −/− mice and shGalectin‐3‐treated HFD‐fed ApoE −/− mice. Scale bar: 50 mm. (K) En face lesion area, quantified as a percentage of total area of the aorta, is significantly smaller in shGalectin‐3‐treated HFD‐fed ApoE −/− mice than in empty vector‐treated HFD‐fed ApoE −/− mice. (L) Representative sections of HE, Oil Red O and Movat's staining in the aortic sinuses are acquired from three different groups of mice. Scale bar: 1 mm. (M) Aortic sinus plaque lesion area, lipid lesion area (red) and mucin area (blue‐green), represented as total area in µm 2 , are much bigger in shGalctin‐3‐treated HFD‐fed ApoE −/− mice than in empty vector‐treated HFD‐fed ApoE −/− mice. (N) The levels of inflammatory cytokines (TNF‐1α, IL‐1β, IL‐18 and IL‐6) in the aortas are measured from three different groups of mice. n = 4–8 mice per group. * p ˂.05, ** p ˂.01, *** p ˂.001 by Student's t test. ns: not significant.

Journal: Clinical and Translational Medicine

Article Title: Macrophage‐derived galectin‐3 contributes to pyroptosis, apoptosis and necroptosis through TLR4/MyD88/NF‐κB/NLRP3 during atherosclerosis

doi: 10.1002/ctm2.70637

Figure Lengend Snippet: Galectin‐3 genetic deficiency or knockdown reduced and, conversely, NLRP3 agonist nigericin augmented atherosclerotic lesions in HFD‐fed ApoE −/− mice. (A) The knockout efficacy of galectin‐3 in the aorta is verified by Western blotting and RT‐qPCR. (B) Schematic diagram of animal study design. Galectin‐3 −/− /ApoE −/− mice and ApoE −/− mice are fed an HFD for 16 weeks, and ApoE −/− mice are intraperitoneally administered with NLRP3 agonist nigericin. (C) Representative images of en face Oil Red O staining in the entire aortas are obtained from ApoE −/− control mice, HFD‐fed ApoE −/− mice, HFD‐fed ApoE −/− mice treated with nigericin, and HFD‐fed Galectin‐3 −/− /ApoE −/− mice. Scale bar: 50 mm. (D) En face lesion area is quantified as a percentage of the total area of the aorta. Compared with those in HFD‐fed ApoE −/− mice, en face lesion areas are significantly smaller in HFD‐fed Galectin‐3 −/− /ApoE −/− mice and, conversely, are markedly bigger in HFD‐fed ApoE −/− mice treated with nigericin. (E) Representative sections of HE, Oil Red O and Movat's staining in the aortic sinuses are acquired from four different groups of mice. Scale bar: 1 mm. (F) Aortic sinus plaque lesion area, lipid lesion area and mucin area are represented as total area in µm 2 . Plaque area, lipid lesion area (red) and mucin area (blue‐green) are much bigger in HFD‐fed ApoE −/− mice treated with nigericin and, conversely, are relatively smaller in HFD‐fed Galectin‐3 −/− /ApoE −/− mice in comparison with HFD‐fed ApoE −/− mice. (G) The levels of inflammatory cytokines in the aortas are measured from four different groups of mice. (H) Schematic illustration of experimental protocol in ApoE −/− mice receiving the injection of AAV‐F4/80 shGalectin‐3/empty vector at the age of 4 weeks. After 2 weeks of a normal diet for rest, these mice are treated with HFD for 16 weeks. (I) The knockdown efficacy of shGalectin‐3 in the aorta is confirmed through Western blotting and RT‐qPCR. (J) Representative images of en face Oil Red O staining in the entire aortas are obtained from HFD‐fed ApoE −/− mice, empty vector‐treated HFD‐fed ApoE −/− mice and shGalectin‐3‐treated HFD‐fed ApoE −/− mice. Scale bar: 50 mm. (K) En face lesion area, quantified as a percentage of total area of the aorta, is significantly smaller in shGalectin‐3‐treated HFD‐fed ApoE −/− mice than in empty vector‐treated HFD‐fed ApoE −/− mice. (L) Representative sections of HE, Oil Red O and Movat's staining in the aortic sinuses are acquired from three different groups of mice. Scale bar: 1 mm. (M) Aortic sinus plaque lesion area, lipid lesion area (red) and mucin area (blue‐green), represented as total area in µm 2 , are much bigger in shGalctin‐3‐treated HFD‐fed ApoE −/− mice than in empty vector‐treated HFD‐fed ApoE −/− mice. (N) The levels of inflammatory cytokines (TNF‐1α, IL‐1β, IL‐18 and IL‐6) in the aortas are measured from three different groups of mice. n = 4–8 mice per group. * p ˂.05, ** p ˂.01, *** p ˂.001 by Student's t test. ns: not significant.

Article Snippet: Membranes were then incubated overnight on a shaker with primary mouse or rabbit antibodies against galectin‐3 (60207‐1‐Ig, Proteintech, China), GSDMD (AF4012, Affinity Biosciences, China), NLRP3 (DF7438, Affinity Biosciences, China), caspase‐3 (66470‐2‐lg, Proteintech, China), caspase‐8 (66093‐1‐Ig, Proteintech, China), RIPK3 (A5431, ABclonal, China), MLKL (A26436, ABclonal, China), Phospho‐MLKL (AP0949, ABclonal, China), TLR4 (GB11519, Servicebio, China), MyD88 (GB12269, Servicebio, China), NF‐κB (10745‐1‐AP, Proteintech, China), Phospho‐NF‐κB ( GB113882 , Servicebio, China) and GAPDH (60004‐1‐Ig, Proteintech, China).

Techniques: Knockdown, Knock-Out, Western Blot, Quantitative RT-PCR, Staining, Control, Comparison, Injection, Plasmid Preparation

Ub-positive endosomes containing Salmonella or beads are targeted by autophagy. (A) HeLa cells were infected with S. Typhimurium ( Salmonella ) for 1 h or transfected with Effectene-coated latex beads for 3 h and then subjected to immunocytochemistry for LC3 and transferrin receptor (TfR). Bar, 10 µm. (B) HeLa cells were infected with Salmonella for 1 h or transfected with Effectene-coated latex beads for 3 h and then subjected to immunocytochemistry for LC3 and galectin3. Bar, 5 µm. (C) HeLa cells were transfected with Effectene-coated latex beads for 3 h and subjected to immunocytochemistry for LC3 and Ub (top) or LC3 and p62 (bottom). Bar, 5 µm. The percentages of LC3- or p62-positive beads per Ub-positive (Ub+) or Ub-negative (Ub−) beads were enumerated. Statistical analysis was performed by Student’s unpaired t test. *, P < 0.01. (D and E) HeLa cells stably expressing GFP-LC3 were transfected with Effectene-coated latex beads for 3 h. Bead–autophagosomes were fractionated as described in Materials and methods. The bead–autophagosome fraction was observed by confocal microscopy (D; bar, 10 µm) or lysed with RIPA buffer and subjected to Western blot analysis using the indicated antibodies (E). In a control sample, scraped cells were mixed with Effectene-coated beads and immediately homogenized. (F) The bead–autophagosome fraction was lysed and subjected to immunoprecipitation with an anti-Ub IgG antibody (FK2) or control IgG. Co-immunoprecipitated molecules were examined by Western blotting using the indicated antibodies. (G and H) NIH3T3 cells stably expressing mStrawberry (mStr)-Gal3 and GFP-LC3, mStr-Gal3, and GFP-p62, or mStr-Gal3 and GFP-Ub were transfected with Effectene-coated latex beads for 30 min and then washed. Live cells were observed at 1-min intervals by fluorescence microscopy. Bar, 3 µm. The time after galectin3 localization was measured for at least 30 cases for each combination (H). Statistical analysis was performed by Student’s unpaired t test. *, P < 0.05; NS, not significant.

Journal: The Journal of Cell Biology

Article Title: Recruitment of the autophagic machinery to endosomes during infection is mediated by ubiquitin

doi: 10.1083/jcb.201304188

Figure Lengend Snippet: Ub-positive endosomes containing Salmonella or beads are targeted by autophagy. (A) HeLa cells were infected with S. Typhimurium ( Salmonella ) for 1 h or transfected with Effectene-coated latex beads for 3 h and then subjected to immunocytochemistry for LC3 and transferrin receptor (TfR). Bar, 10 µm. (B) HeLa cells were infected with Salmonella for 1 h or transfected with Effectene-coated latex beads for 3 h and then subjected to immunocytochemistry for LC3 and galectin3. Bar, 5 µm. (C) HeLa cells were transfected with Effectene-coated latex beads for 3 h and subjected to immunocytochemistry for LC3 and Ub (top) or LC3 and p62 (bottom). Bar, 5 µm. The percentages of LC3- or p62-positive beads per Ub-positive (Ub+) or Ub-negative (Ub−) beads were enumerated. Statistical analysis was performed by Student’s unpaired t test. *, P < 0.01. (D and E) HeLa cells stably expressing GFP-LC3 were transfected with Effectene-coated latex beads for 3 h. Bead–autophagosomes were fractionated as described in Materials and methods. The bead–autophagosome fraction was observed by confocal microscopy (D; bar, 10 µm) or lysed with RIPA buffer and subjected to Western blot analysis using the indicated antibodies (E). In a control sample, scraped cells were mixed with Effectene-coated beads and immediately homogenized. (F) The bead–autophagosome fraction was lysed and subjected to immunoprecipitation with an anti-Ub IgG antibody (FK2) or control IgG. Co-immunoprecipitated molecules were examined by Western blotting using the indicated antibodies. (G and H) NIH3T3 cells stably expressing mStrawberry (mStr)-Gal3 and GFP-LC3, mStr-Gal3, and GFP-p62, or mStr-Gal3 and GFP-Ub were transfected with Effectene-coated latex beads for 30 min and then washed. Live cells were observed at 1-min intervals by fluorescence microscopy. Bar, 3 µm. The time after galectin3 localization was measured for at least 30 cases for each combination (H). Statistical analysis was performed by Student’s unpaired t test. *, P < 0.05; NS, not significant.

Article Snippet: The following antibodies were used: anti–mouse Atg16L1 , anti-p62 (MBL), anti-LC3 (MBL), anti-transferrin receptor (Invitrogen), anti-poly Ub (clone FK2; BIOMOL), anti-K48 linked Ub (clone Apu2; EMD Millipore), anti-K63 linked Ub (clone Apu3; EMD Millipore) anti-galectin3 (Santa Cruz Biotechnology, Inc.), anti-Lamp1 (Santa Cruz Biotechnology, Inc.), anti-FLAG (clone M2; Sigma-Aldrich), anti-GFP (Roche), anti-Myc (clone 9E10), and anti–α-tubulin (clone B5-1-2; Sigma-Aldrich).

Techniques: Infection, Transfection, Immunocytochemistry, Stable Transfection, Expressing, Confocal Microscopy, Western Blot, Control, Immunoprecipitation, Fluorescence, Microscopy

Ubiquitination and recruitment of Atg proteins. (A and B) NIH3T3 cells stably expressing mStr-Ub and GFP-tagged LC3, Atg5, WIPI-1, Atg14L1, or ULK1 were transfected with Effectene-coated latex beads for 30 min. Then, live cells were observed at 1-min intervals by fluorescence microscopy. Bar, 3 µm. The time after Ub localization was measured for at least 30 cases for each combination. Each value represents the mean ± SD. Statistical analysis was performed by Student’s unpaired t test. *, P < 0.05; NS, not significant. (C) NIH3T3 cells stably expressing GFP-tagged Ub, LC3, Atg5, WIPI-1, Atg14L1, Atg9L1, or ULK1 were transfected with Effectene-coated beads for 3 h in the presence or absence (mock) of 30 µM UBEI-41 (a ubiquitin E1–specific inhibitor) and subjected to immunocytochemistry for galectin3. The percentages of GFP-positive per galectin3-positive beads were enumerated. At least 30 beads were counted ( n = 3). The values are the mean ± SD. Statistical analysis was performed by Student’s unpaired t test. *, P < 0.05. (D and E) Parent NIH3T3 cells, Atg4B mutant overexpressing NIH3T3 cells (D), wild-type MEFs, and Atg5-KO MEFs (E) stably expressing GFP-tagged LC3, Atg5, WIPI-1, Atg14L1, Atg9L1, or ULK1 were transfected with Effectene-coated latex beads for 3 h and subjected to immunocytochemistry for galectin3. The percentages of Atg-positive per galectin3-positive beads were enumerated. At least 30 beads were counted ( n = 3). The values are the mean ± SD.

Journal: The Journal of Cell Biology

Article Title: Recruitment of the autophagic machinery to endosomes during infection is mediated by ubiquitin

doi: 10.1083/jcb.201304188

Figure Lengend Snippet: Ubiquitination and recruitment of Atg proteins. (A and B) NIH3T3 cells stably expressing mStr-Ub and GFP-tagged LC3, Atg5, WIPI-1, Atg14L1, or ULK1 were transfected with Effectene-coated latex beads for 30 min. Then, live cells were observed at 1-min intervals by fluorescence microscopy. Bar, 3 µm. The time after Ub localization was measured for at least 30 cases for each combination. Each value represents the mean ± SD. Statistical analysis was performed by Student’s unpaired t test. *, P < 0.05; NS, not significant. (C) NIH3T3 cells stably expressing GFP-tagged Ub, LC3, Atg5, WIPI-1, Atg14L1, Atg9L1, or ULK1 were transfected with Effectene-coated beads for 3 h in the presence or absence (mock) of 30 µM UBEI-41 (a ubiquitin E1–specific inhibitor) and subjected to immunocytochemistry for galectin3. The percentages of GFP-positive per galectin3-positive beads were enumerated. At least 30 beads were counted ( n = 3). The values are the mean ± SD. Statistical analysis was performed by Student’s unpaired t test. *, P < 0.05. (D and E) Parent NIH3T3 cells, Atg4B mutant overexpressing NIH3T3 cells (D), wild-type MEFs, and Atg5-KO MEFs (E) stably expressing GFP-tagged LC3, Atg5, WIPI-1, Atg14L1, Atg9L1, or ULK1 were transfected with Effectene-coated latex beads for 3 h and subjected to immunocytochemistry for galectin3. The percentages of Atg-positive per galectin3-positive beads were enumerated. At least 30 beads were counted ( n = 3). The values are the mean ± SD.

Article Snippet: The following antibodies were used: anti–mouse Atg16L1 , anti-p62 (MBL), anti-LC3 (MBL), anti-transferrin receptor (Invitrogen), anti-poly Ub (clone FK2; BIOMOL), anti-K48 linked Ub (clone Apu2; EMD Millipore), anti-K63 linked Ub (clone Apu3; EMD Millipore) anti-galectin3 (Santa Cruz Biotechnology, Inc.), anti-Lamp1 (Santa Cruz Biotechnology, Inc.), anti-FLAG (clone M2; Sigma-Aldrich), anti-GFP (Roche), anti-Myc (clone 9E10), and anti–α-tubulin (clone B5-1-2; Sigma-Aldrich).

Techniques: Ubiquitin Proteomics, Stable Transfection, Expressing, Transfection, Fluorescence, Microscopy, Immunocytochemistry, Mutagenesis